Showing posts with label USD Trend. Show all posts

Tuesday 27 May 2014

Forex: Euro at Risk as Dovish Commentary Stokes Easing Speculation


The economic calendar remains quiet in European hours, with Swiss Trade Balance figures amounting to the only bit of noteworthy event risk on the docket. The trade surplus is expected to edge to CHF 2.1 billion in April, marking a hairline improvement over the prior month. The release probably won’t meaningful direction cues to the Swiss Franc considering its limited implications for SNB monetary policy. Indeed, with the central bank forecasting inflation below 1 percent through 2015, Thomas Jordan and company seem unlikely to step away from an ultra-accommodation policy regime for some time yet.
Elsewhere, traders will continue to watch sideline commentary from the ECB Conference on Central Banks going into its third day in Sintra, Portugal. Policymakers have gathered to discuss ways to address the lingering disinflation problem in the Eurozone with an eye to potentially introduce an expanded stimulus effort as soon as next week. Dovish rhetoric from the summit has failed to apply downward pressure on the Euro thus far but that can swiftly change if vague pronouncements about the severity of the situation are replaced with actionable policy prescriptions. We remain short EUR/USD.
The spotlight turns to US data later in the day, with April’s Durable Goods Orders report and May’s Consumer Confidence reading on the docket. US economic news-flow has increasingly improved relative to expectations in early April, suggesting analysts are underestimating the economy’s resilience and opening the door for upside surprises. Such outcomesare likely to help scatter doubts about continued “tapering” of QE asset purchases, stoking speculation about subsequent interest rate hikes and boosting the US Dollar.
Thursday 1 May 2014

FOREX Daily Updates: USD/SEK Trend Today


FOREX Updates:
The dollar traded unchanged or lower against the other G10 currencies during the European morning Thursday. It depreciated against NZD, SEK, CHF, GBP, JPY and EUR, while it remained near its early morning levels vs AUD, CAD and NOK.
This morning the only economic releases were from the UK. The day started with the Nationwide house price index which accelerated to +1.2% mom in April, beating market estimates of +0.6% mom. A few hours later, the BoE mortgage approvals for March missed estimates but at the same time the UK manufacturing PMI for April exceeded expectations. The index rose to 57.3, beating market expectations of 55.4, while the March number was revised up to 55.8 from 55.3. GBP/USD moved higher on the better-than-expected manufacturing report, breaking above yesterday’s highs of 1.6900. Under normal circumstances such a break could have larger bullish implications targeting the key barrier of 1.7000, but considering the positive expectations for Friday’s NFP number, we may experience a corrective wave before the close of the week. 
WTI continued its decline after a report yesterday showed that crude stockpiles increased by 1.7mn barrels to 399.4mn the week ended April 25, the highest level of stockpiles since the EIA (Energy Information Administration) started reporting weekly data in 1982. After pausing near the 99.35 support barrier, WTI fell below it, thus I would expect the price to meet support at 98.85.

USD/SEK Trend:
USD/SEK moved lower this morning to meet the support at the purple return line and the 6.4765 (S1) barrier. The overall short-term path of the rate remains to the downside, since the pair is trading below the blue downtrend line and below both the moving averages. However, considering positive divergence between both our momentum studies and the price action, and the fact that the RSI exited its oversold zone, I would expect the forthcoming leg to be to the upside. A clear move above the 6.5025 (R1) support could confirm the rebound and may target the next hurdle at 6.5195 (R2). In the larger picture, the 6.4765 (S1) support coincides with the 50% retracement of the 19th March - 21st April uptrend, which makes the aforementioned support even stronger.
Support: 6.4765 - 6.4385 - 6.3965
Resistance: 6.5025 - 6.5195 - 6.5530

Monday 28 April 2014

Technical Analysis GBP/USD For Today: 28 April


After the formation of bullish divergence quotes continue to rise in the direction of correction level 161.8%- 1.7250. Bullish Divergence indicator MACD: last low quotations turned higher than the previous low, a similar indicator- below the previous. If the last low quotes is passed, then the pair will perform a U-turn in favor of the U.S. currency and starts falling, and the divergence is canceled. Emerging divergence is observed. Securing of the pair below the 100.0 % Fib- 1.6319 increase the chances of a further fall in the direction of the next correction level 76.4%- 1.5968.

Quotes on 4-hour chart continues the process of falling in the direction of correction level 200.0% - 1.6697 after the formation of a bearish divergence. Bearish divergence of the indicator MACD: last peak quotations received the same with the previous one, and the same peak indicator - below the previous. Retreat from the correction level 200.0% April 28, allows traders to expect a reversal in favor of the currency of England and some growth in the direction of 261.8% Fib level - 1.7289. Securing of the pair below the 200.0% correction will allow to count on a continued fall.

For Daily Trend and Signal Please visit @ MarketLive365.com

Friday 28 February 2014

USD/CAD Trend: FOREX Updates Today

USD/CAD Trend:
A slowdown in Canada’s Gross Domestic Product (GDP) may heighten the bearish sentiment surrounding the Canadian dollar as it raises the Bank of Canada’s (BoC) scope to cut the benchmark interest rate later this year.

In light of the protracted recovery, Governor Stephen Poloz may take additional measures to encourage a ‘soft landing,’ and a material shift in the policy outlook may produce fresh highs in the USDCAD as the Federal Reserve remains poised to discuss another $10B taper in March.

The widening trade deficit along with the slack in private sector consumption may generate a dismal GDP report, and a material slowdown in the growth rate may trigger a bearish reaction in the Canadian dollar as it heighten bets for a BoC rate cut.

Nevertheless, the pickup in employment paired with the rise in business investments may help to produce a positive result, and better-than-expected GDP print may spur a short-term pullback in the USDCAD as market participants scale back bets for more monetary easing.

FOREX Updates Today:
The Canadian Dollar saw a bit of strength following the better than expected QoQ GDP print, but the USD/CAD pair remained supported by a key break and hold of former resistance at the July and September highs. The pair closed out the Thanksgiving weekend higher and has since continued to push higher on technical factors as well as fundamentals. Data out of Canada since December has been dismal to say the least, but as of late we have seen a slight correction to the downside. A poor GDP print here may help fuel momentum in the breakout.

Monday 17 February 2014

FOREX Signal For USD/CHF with Today's Trend

The USD/CHF continues downward movement has no correction, and even 1-2 less strong bull bars are also absent.

FOREX Signal For USD/CHF
Current sell signal-strong and confirmed as Chinkou Span entrenched below the price, and the price is below the Ichimoku cloud. So now the goal for the downward movement is the first support level 0.8873. If the price is below the first target has to be available new target for downward movement- the second support level 0.8821.
Downward movement has prospects as long as price is below the Kijun-sen (0.8970) if the price consolidates above the critical line, then a sell signal will be weakened, and the continuation of the downward movement called into question, but may continue upward movement with the aim of first resistance level 0.9007. Chinkou Span is below the price chart, which confirms the current sell signal and indicates a bearish market sentiment for the currency pair USD/CHF.

FOREX Trend and News Today:
Bollinger Bands show a continuation of the downward movement, the bands widen and sent down, so now it is recommended to consider options for short positions. MACD turned down which indicates a downward price movement if the indicator unfold upward, it could signal the beginning of the corrective movement. Indicator also can start at any time to discharge. If the price bounces from 0.8873 level, it can also trigger coil upward correction.

Trading recommendations: franc on the foreign exchange market is now advised to consider shorts with the first goal -0.8873 . When fixing prices below the first target, a target for sales are encouraged to consider the level of 0.8821. Stop-loss orders placed above 0.8970, and if this line will be reduced, it is possible to carry stop-loss after her. Close short positions recommended in case prices rebound from 0.8873 or turn up the MACD indicator. When profitnye deal 50-60 points, stop-loss can be transferred to zero. Take- profits can be set slightly higher than the target levels by about 5-10 points- at the levels of 0.8880 and 0.8825. In addition to the technical picture should also consider the fundamental data and the time of their release.

Tuesday 21 January 2014

US Dollar and S&P 500 Technical Analysis For Today

US DOLLAR TECHNICAL ANALYSIS – Prices are eyeing resistance in the 10761-66 area, marked by the 38.2% Fibonacci expansion and the top of a rising channel. A break higher exposes the 50% level at 10806. Reversing below the 10707-27 region (December 19 high, 23.6% Fib) targets the channel bottom, now at 10644.

S&P 500 TECHNICAL ANALYSIS – Prices are testing resistance in the 1844.90-49.10 area, marked by the December 31 high and the 14.6% Fibonacci expansion. A break higher exposes the 23.6% level at 1863.10. Near-term support is at 1819.60, the 14.6% Fib retracement.

Thursday 2 January 2014

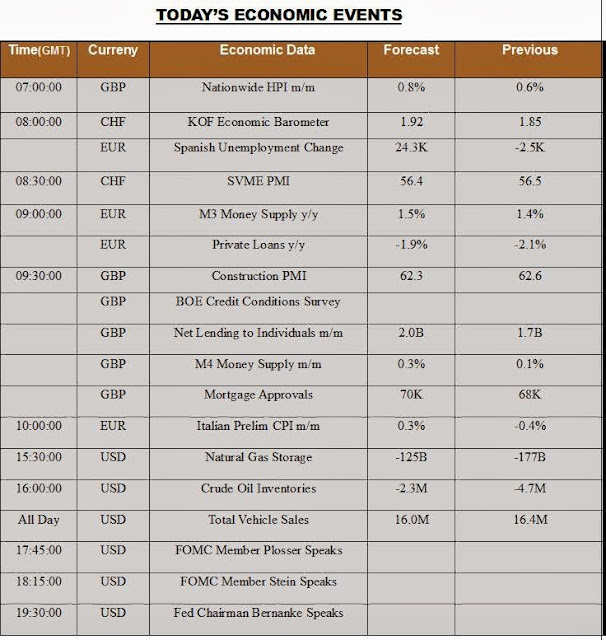
Today's Economic Data: USD Trading Bullish Against CHF

FOREX Data

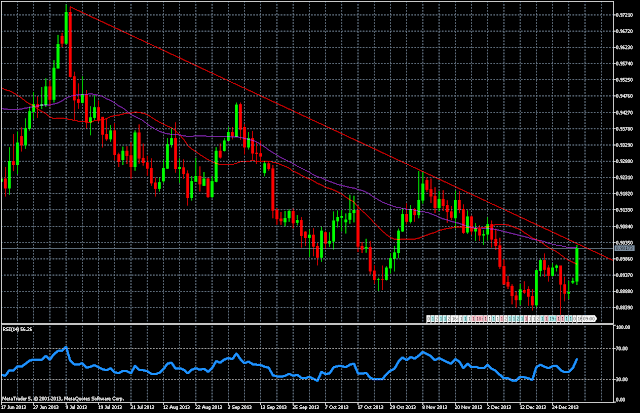
USD/CHF after todays strong rally, took resistance at trendline. If it sustains below 0.8975 till today's session ends, It can turn bearish for the next week.

Chart Analysis of USD/CHD| USD Trend Today

USD/CHD Chart

Chart Analysis of USD/CHD

USD/CHD maed high of 0.9026. Trading around trendline resistance now. Be cautious now.